






Show Your Stripes Day 2024
Raising awareness of climate change through Ed Hawkins' compelling visuals for Show Your Stripes Day 2024.
Raising awareness of climate change through Ed Hawkins' compelling visuals for Show Your Stripes Day 2024.
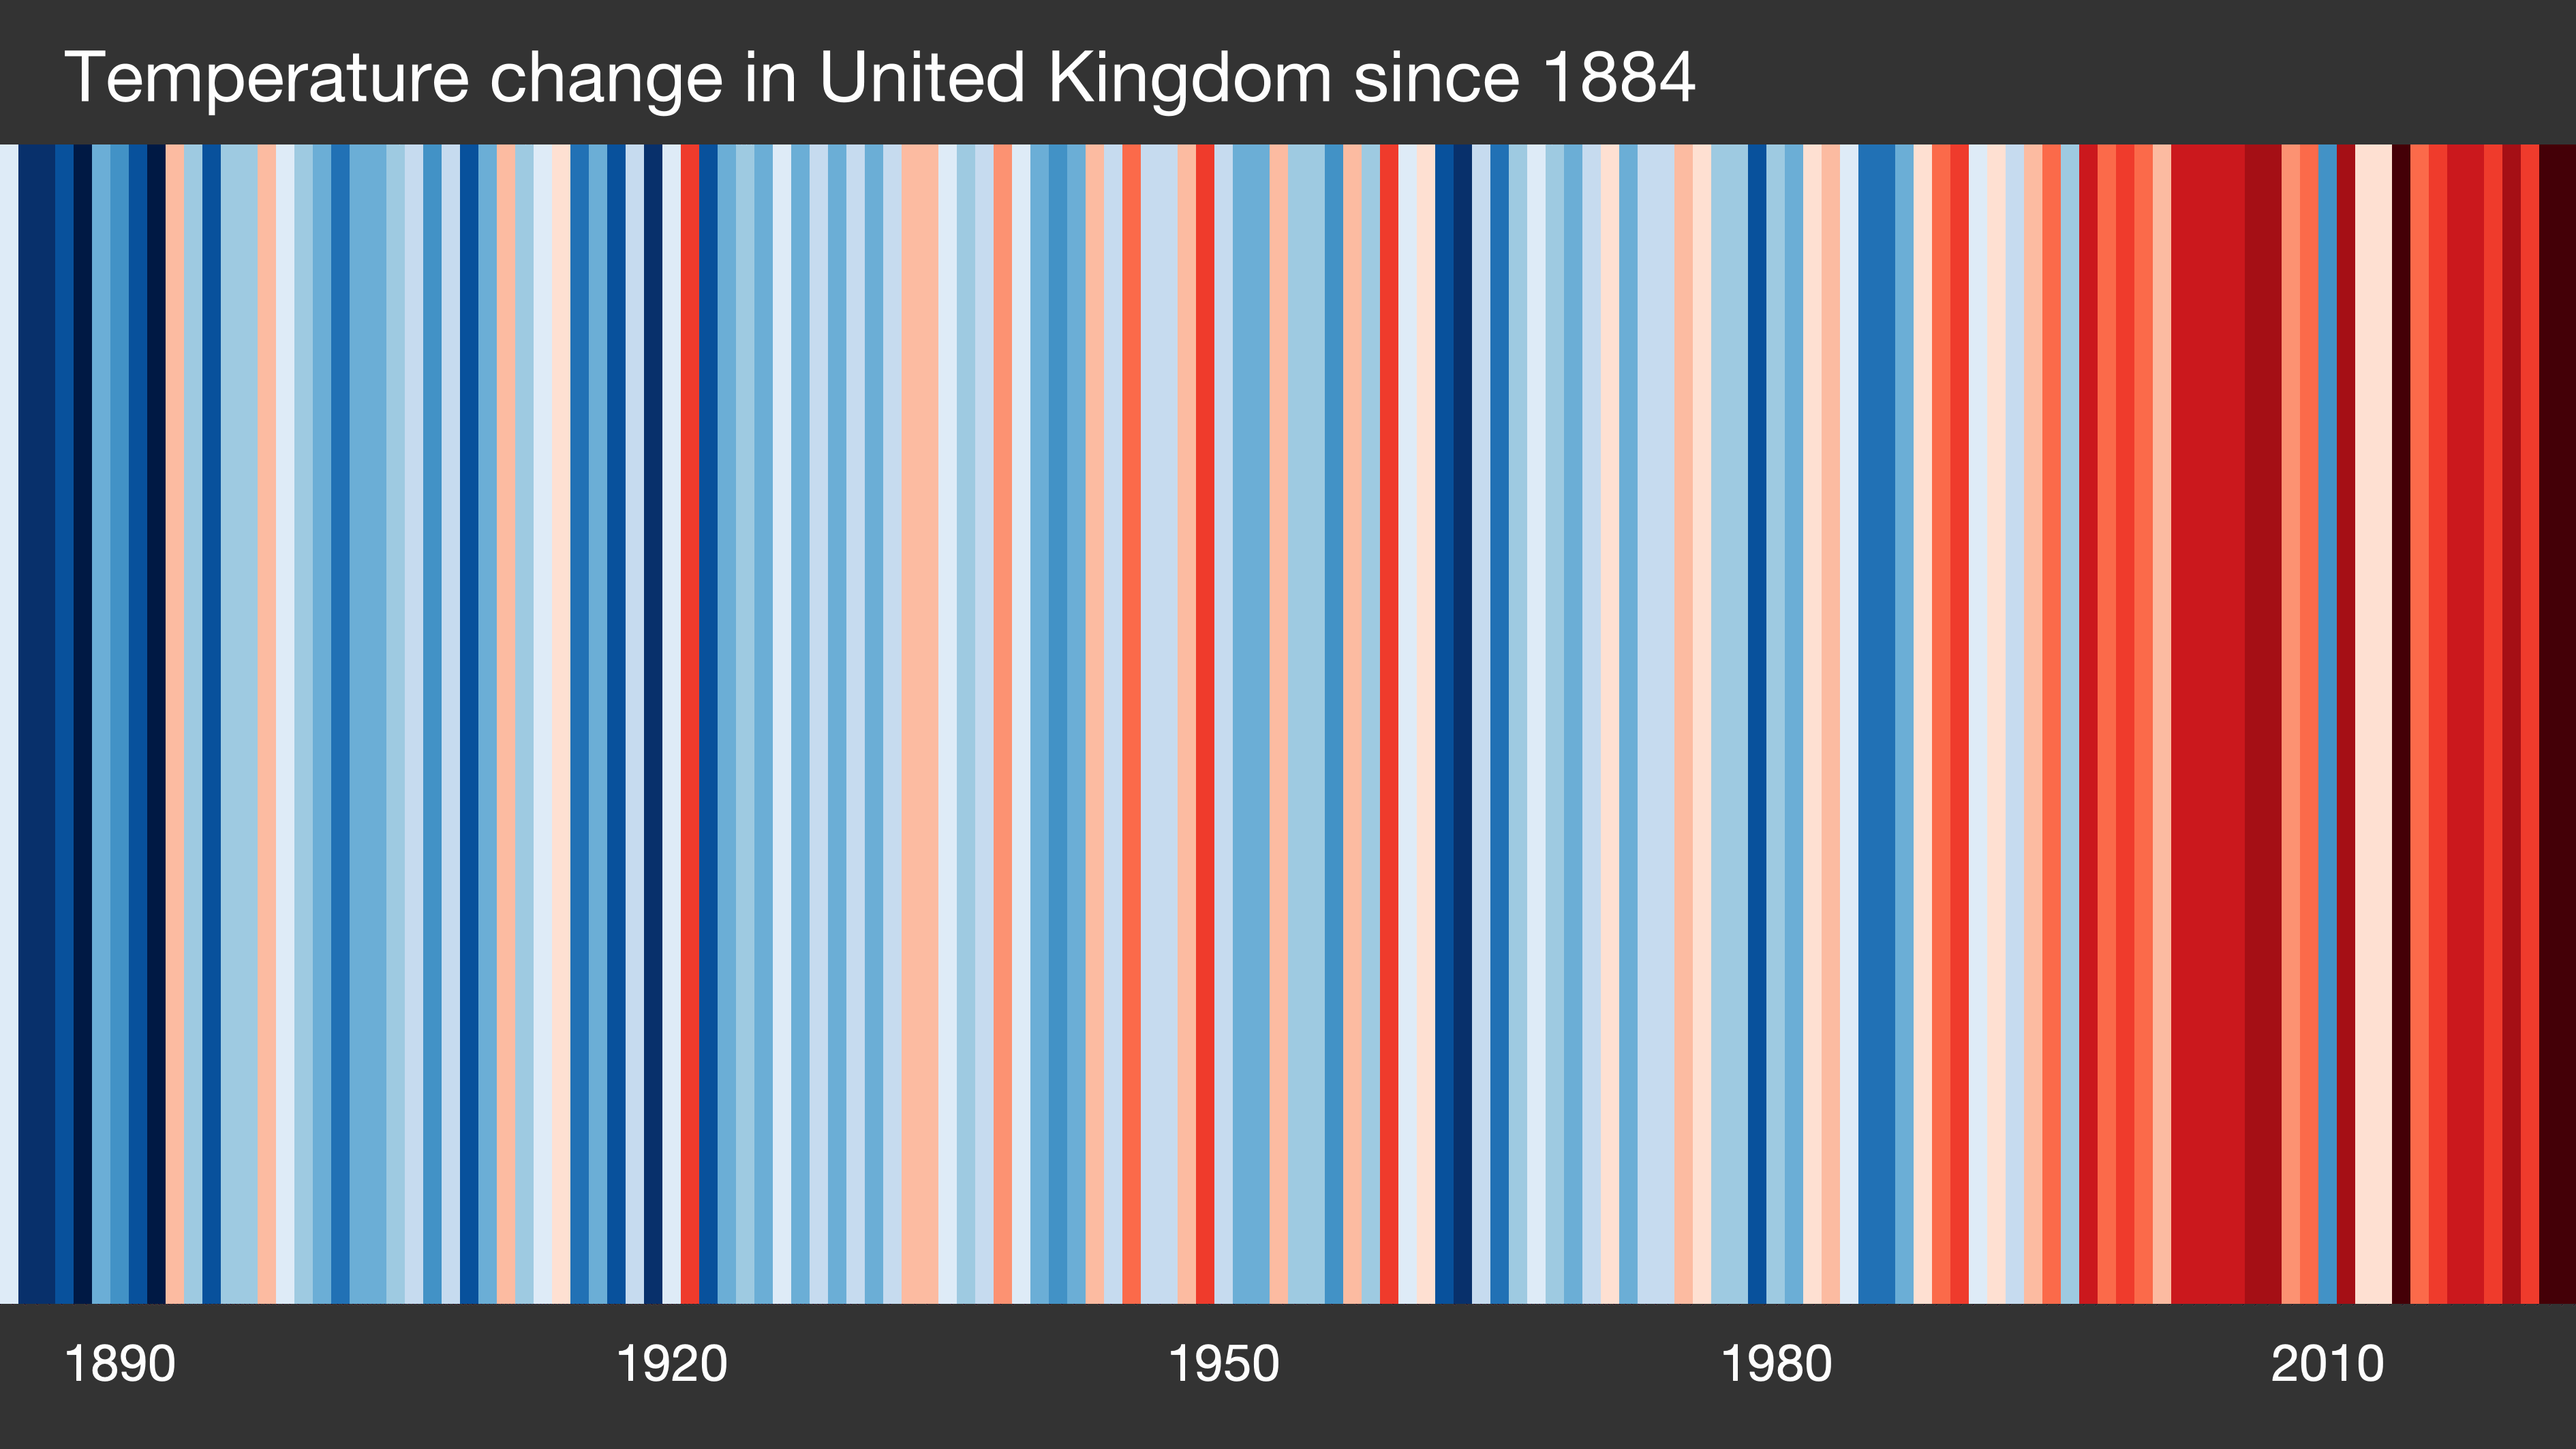
The Warming Stripes are a powerful graphic representation of how temperatures have increased around the world since the industrial revolution. They were produced by Professor Ed Hawkins at University of Reading to start conversations about our warming world and the risks of climate change.
These stripes represent the UK average temperature from 1884 to 2023. Each stripe represents one year, with colours transitioning from cool blues to dark reds to represent the increases in temperature seen throughout the past 130 years.
Show Your Stripes Day also shows the power of a single image in communicating complex scientific data. The construction industry has a key role to play to mitigate climate change and this shapes our approach to many aspects of our work.
Click the website link below to explore the data and graphics for specific cities in the UK and across the globe:
Imagery Credit: Professor Ed Hawkins, University of Reading